今天锋哥给大家分享一下如何在TradingView 视图中添加短线指标。下面是具体代码
//@version=6
indicator(title="EMA 4/12/20/60", overlay=true, timeframe="", timeframe_gaps=true)
shortest = ta.ema(close, 4)
short = ta.ema(close, 12)
longer = ta.ema(close, 20)
longest = ta.ema(close, 60)
plot(shortest, color=color.rgb(255, 0, 0))
plot(short, color = color.rgb(255, 0, 234))
plot(longer, color = color.rgb(28, 255, 7))
plot(longest, color = color.rgb(105, 9, 230))
实际效果:

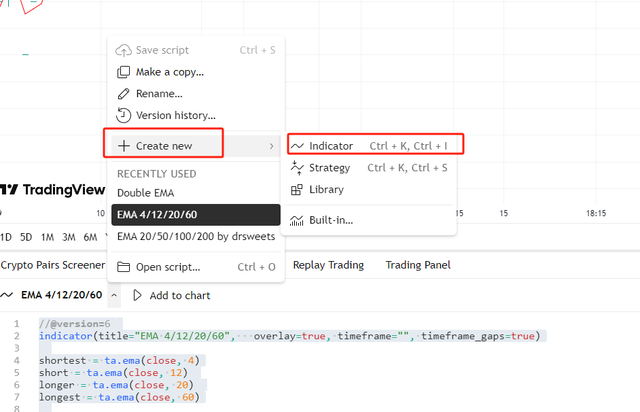
代码在PINE Editor中的效果:

具体使用很简单,首先登陆你的账号之后,然后打开任意一个交易标的,随便,比如QQQ,然后进入chart 视图,然后最下面不是有PINE Editor吗?
那你就创建一个新的指标:

然后在下面的编辑器输入上面我贴出来的代码。
记得点一下发布,就可以用这个指标了。
你自己加的指标,可以在下面的这个地方看到:

